Who is this for?
Data professionals looking to become more familiar with concepts across data engineering, analytics engineering and the modern data stack.
If you’d like to learn more about the history of the modern data stack and how it has evolved in the past 20 years, I recommend this post:
The Modern Data Stack: Past, Present, and Future
Why this post?
If you’ve read some of my earlier posts, you’ve probably noticed that my focus is on analyzing data, more aligned with the data scientist role.
Those posts assume the data to be perfect, where all you need to do is:
import pandas as pd
df = pd.read_csv("really_clean_nonexistent_data.csv")
In reality, that’s rarely the case. Real-world data is messy. It’s thanks to data engineers that the data gets cleaned, organized, and made accessible to data scientists and others across the company.
As access to information becomes easier than ever, I believe we, as data professionals, should push ourselves to understand more of the entire analytics stack — not just our slice of it. That’s what motivated me to write this post.
Agenda
Project Overview
Data Stack
Let’s get started!
Project Overview
The project consists of transforming publicly available New York City subway data into insights.
Why should you care? You will understand how the data flows. Different tools, packages and libraries will be introduced and you will begin to understand what problems they solve.
Data Stack
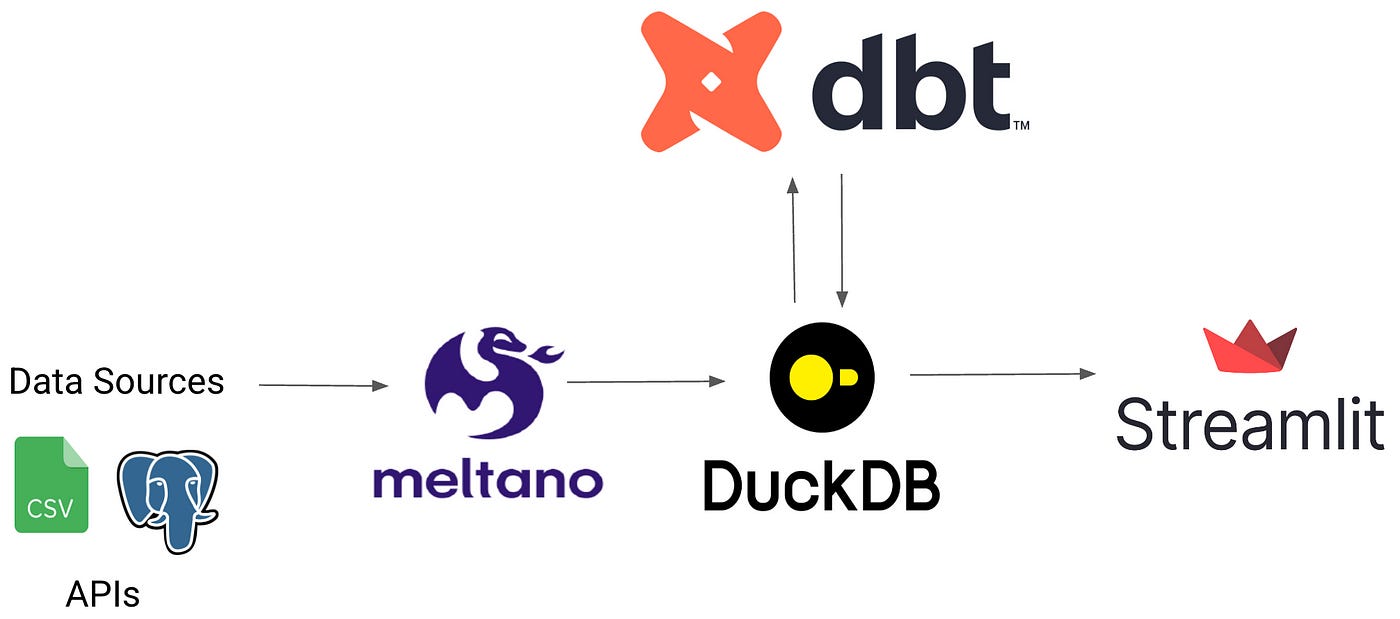
This is the project’s data stack. An entire blog post could be written for each part of this stack, but this post will give a brief introduction to each one of them.
Meltano: an EL tool for data engineers
It’s an open-source platform for managing extract, and load jobs.
Extractors and loaders are key components in a ETL job.
Extractors are responsible for retrieving the data from different sources such as APIs, databases, CSV or Excel files.
Loaders take the extracted data and load it into a destination. In this project, the destination is a DuckDB database.
Meltano’s Hub shows the list of extractors and loaders they currently support, and they have great documentation on how to use them.
So far the data flows: Raw Subway Data (CSV) → Meltano → Parquet file
More precisely:
Raw NYC subway data is a CSV file
I extract it and load it into parquet files using meltano
Check out the data-pipeline/meltano.yml file to see the extractor and loader I used.
dbt: the transformation tool
dbt is an open-source command line tool that handles the T in ELT (Extract, Load, Transform).
Simply put, once the data is stored in the data warehouse, dbt shines at transforming the data. This transformation is done using SQL.
For example: we want to know the busiest stations in each borough.
From the raw_subway_data, we can create a query (model) that calculates this and the output will be stored as a view or table inside of the data warehouse.
-- busiest_stations.sql
-- rider count per station in each borough
select
    borough,
    station_complex,
    count(*) rider_count
from {{ ref('raw_subway_data') }}
group by
    borough,
    station_complex
This model transforms the data and can now be used for visualization or other purposes.
In the project I created four models.
The first model stores the raw data from the parquet file in the DuckDB database, raw_subway_data.sql.
The other models are created inside of DuckDB.
The models are found here data_transform/models.
You can specify where your models will be stored in the profiles.yml configuration file.
data_transform:
  target: dev
  outputs:
    dev:
      type: duckdb
      path: /Users/juanherrera/Desktop/nyc-subway-analytics/data/subway_data.duckdb
      schema: main
DuckDB:
DuckDB is a column-oriented Relational Database Management System, that is high performant against large datasets.
You write SQL code to efficiently query your data, allowing you to perform complex.
All the data models are stored in DuckDB, this is the project’s database: subway_data.duckdb
More on DuckDB in the link below:
Streamlit:
Once our data models are stored in our DuckDB database, we can effectively query it and start populating our data app using Streamlit.
Below is a guide on how to navigate the repo.
Thank you for reading!


